


EURUSD Pivot Point Today
Technical Analysis based on daily pivot point December 19 - Join XM Global 90% Cashback Auto Rebate
TECHNICAL ANALYSISMARKET UPDATES
Tradewithxm
12/19/20242 min read
EUR/USD Analysis Using Pivot Points (19th December 2024)
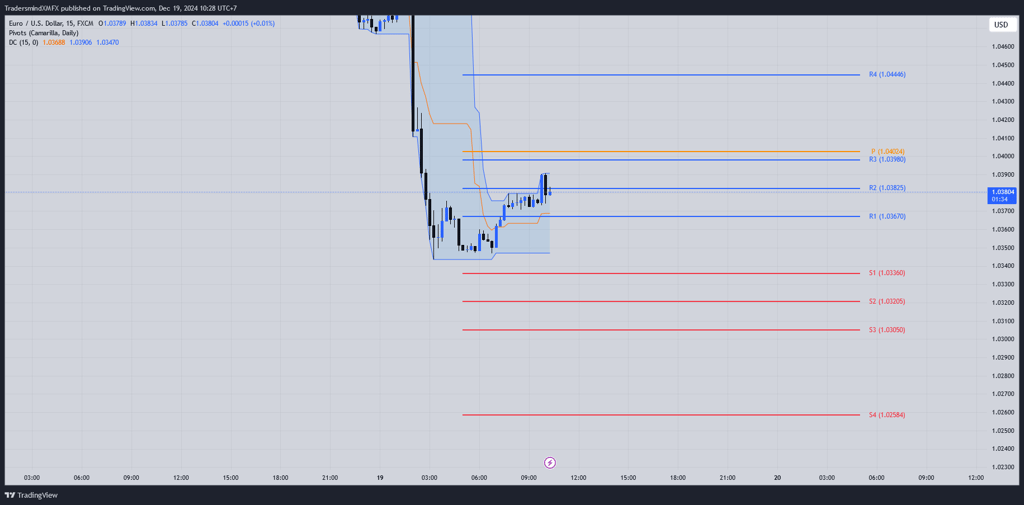
Pivot points are one of the most effective tools in technical analysis, particularly for intraday traders. The EUR/USD chart above showcases a detailed pivot point analysis, helping traders identify key levels of support, resistance, and potential price movement.
Let’s break down the pivot levels shown in the chart and explore how you can use them to trade effectively.
Pivot Point Levels on the Chart
Here are the pivot levels from the analysis:
Pivot Point (P): 1.04024
Resistance Levels:
R1: 1.03670
R2: 1.03825
R3: 1.03980
R4: 1.04446
Support Levels:
S1: 1.03360
S2: 1.03205
S3: 1.03050
S4: 1.02584
Key Observations
Price Action Around the Pivot Point
The price is hovering slightly below the pivot point (1.04024), suggesting indecision in the market.
This zone is critical for determining whether the price will turn bullish or bearish in the coming hours.
Resistance Levels in Focus
If the price moves above the pivot, the first resistance level (R1: 1.03670) will act as an initial target.
Further upward movement could test R2 (1.03825) and R3 (1.03980), with the possibility of reaching R4 (1.04446) in a bullish scenario.
Support Levels as Key Safety Nets
If the price drops, the nearest support level (S1: 1.03360) will serve as a key point for potential buying interest.
Below this, S2 (1.03205) and S3 (1.03050) are the next levels to watch.
Consolidation Zone
The price seems to be consolidating within a narrow range defined by R1 and S1. Traders can watch for a breakout in either direction to determine the next major move.
Trading Strategies for EUR/USD
1. Bullish Scenario: Breakout Above the Pivot
Entry Point: Buy above the pivot point (1.04024).
Take Profit: Target R1 (1.03670) or R2 (1.03825).
Stop Loss: Below the pivot point.
2. Bearish Scenario: Drop Below S1
Entry Point: Sell below S1 (1.03360).
Take Profit: Target S2 (1.03205) or S3 (1.03050).
Stop Loss: Above the pivot point.
3. Range-Bound Strategy
If the price continues to consolidate:
Buy near S1 (1.03360).
Sell near R1 (1.03670).
Stop Loss: Place stops slightly outside the range to avoid false breakouts.
The EUR/USD analysis using pivot points offers a clear framework for traders to navigate the market. Whether you are looking for breakout opportunities or range-bound trades, these levels provide an objective basis for decision-making.
However, as with any technical tool, pivot points should be combined with other indicators like moving averages or candlestick patterns for confirmation. Always back-test your strategy and manage your risks effectively.
Happy trading!
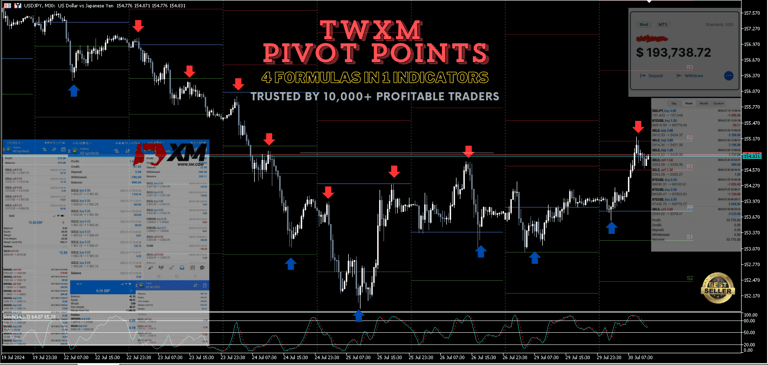
Free Tradewithxm 4-in-1 Pivot Point Indicator
Easy to install - plug in directly to your metatrader 5
Your Capital at Risk*
XM GLOBAL INTRODUCING BROKER
Lifetime 90% cashback on every transactions with XM Global under our IB partnership, rebates only works if you're using our XM Partners Code 6M888
CONTACT
owner@tradewithxm.com
© 2024. All rights reserved.
XM Global Limited, registered by the Financial Services Commission (FSC) under the Securities Industry Act 2021 (license number 000261/4) and Trading Point of Financial Instruments Limited, authorised and regulated by Cyprus Securities and Exchange Commission (CySEC) (licence number 120/10), are members of Trading Point Group.
Risk Warning: Our services involve a significant risk and can result in the loss of your invested capital.
Restricted Regions: XM Global Limited does not provide services for the residents of certain countries, such as the United States of America, Canada, Argentina, Israel and the Islamic Republic of Iran.