


EURUSD Pivot Point Today
Trades EURUSD Perfectly with Pivot Point Dec 27- XM Global Partner Code Biggest Rebate Cashback 6M888 $8.50/Lot up to $80/Lot. 20,000+ Affiliated Traders and 512+ Partners.
TECHNICAL ANALYSISMARKET UPDATES
12/27/20242 min read
EUR/USD Analysis Using Pivot Points, Bollinger Bands, and Key Technical Insights
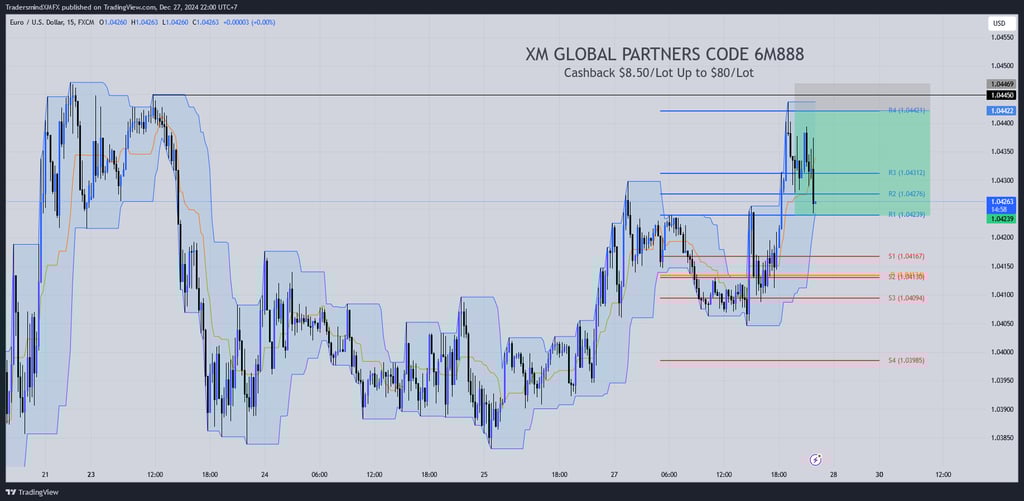
The chart represents the EUR/USD pair on a 15-minute timeframe, equipped with pivot points and Bollinger Bands. These tools are utilized for analyzing market sentiment, key price levels, and potential price behavior.
Technical Indicators Breakdown
Pivot Points:
The chart includes standard pivot levels, which are critical for identifying potential support and resistance zones:
Resistance Levels (R1, R2, R3, R4):
R1: 1.04239
R2: 1.0476
R3: 1.04312
R4: 1.04421
Support Levels (S1, S2, S3, S4):
S1: 1.04167
S2: 1.04136
S3: 1.04094
S4: 1.03985
These pivot levels are commonly used for intraday trading strategies.
Bollinger Bands:
The bands display market volatility and price direction:
Price action near the upper band indicates overbought conditions.
Price action near the lower band signals oversold conditions.
The middle line acts as a dynamic support/resistance level, based on a moving average.
Fibonacci Retracement Tool:
A shaded green rectangle in the upper price range suggests the use of a Fibonacci retracement zone or a consolidation range that could act as a take-profit area for buyers.
Price Action and Key Observations
Bullish Momentum:
The price action shows a clear bullish breakout above R1 (1.04239) and an approach toward R2 (1.0476), suggesting strong upward momentum.
Buyers seem to dominate the market, as evident from consecutive bullish candles.
Resistance Testing:
The price has reached near R3 (1.04312), and further upward movement could challenge R4 (1.04421).
This area could act as a profit-taking zone, and price rejection may lead to a correction.
Support Holding:
Key supports lie at S1 (1.04167) and S2 (1.04136). A breakdown below these levels could indicate a trend reversal.
Volatility Analysis:
Bollinger Band expansion shows increased volatility as the price moves upward. A pullback to the middle band or lower band could provide re-entry opportunities for buyers.
Trading Strategies
Bullish Strategy:
Entry: Look for long positions near the middle Bollinger Band or on pullbacks to R1 (1.04239).
Target: R3 (1.04312) and R4 (1.04421).
Stop Loss: Below R1 or the lower Bollinger Band, around 1.04150.
Bearish Strategy (if reversal occurs):
Entry: Consider short positions if price rejects R3 or R4 and falls below R2.
Target: S1 (1.04167) or S2 (1.04136).
Stop Loss: Above R3 or the breakout level.
Neutral/Range-Bound Strategy:
Trade between the upper and lower Bollinger Bands if the price consolidates.
The EUR/USD chart indicates a strong bullish sentiment, with price testing key resistance levels. The use of pivot points and Bollinger Bands suggests potential entry points for both bullish and bearish scenarios, depending on market direction. Traders should monitor price behavior near R3 and R4, as well as S1 and S2, to determine the next significant move. Combining this technical analysis with fundamental factors such as economic data or central bank decisions can enhance trade outcomes.


XM GLOBAL INTRODUCING BROKER
Lifetime 90% cashback on every transactions with XM Global under our IB partnership, rebates only works if you're using our XM Partners Code 6M888
CONTACT
owner@tradewithxm.com
© 2024. All rights reserved.
XM Global Limited, registered by the Financial Services Commission (FSC) under the Securities Industry Act 2021 (license number 000261/4) and Trading Point of Financial Instruments Limited, authorised and regulated by Cyprus Securities and Exchange Commission (CySEC) (licence number 120/10), are members of Trading Point Group.
Risk Warning: Our services involve a significant risk and can result in the loss of your invested capital.
Restricted Regions: XM Global Limited does not provide services for the residents of certain countries, such as the United States of America, Canada, Argentina, Israel and the Islamic Republic of Iran.