


EURUSD Pivot Point Today
EURUSD Pivot Point January 2, 2025 - Price Action, Donchian and Candlestick Pattern. XM Global Biggest Cashback Code 6M888. claim $8.50 up to $80/lot on every transactions you make.
TECHNICAL ANALYSISLEARNING
1/2/20252 min read
Comprehensive Technical Analysis Based on EUR/USD Chart
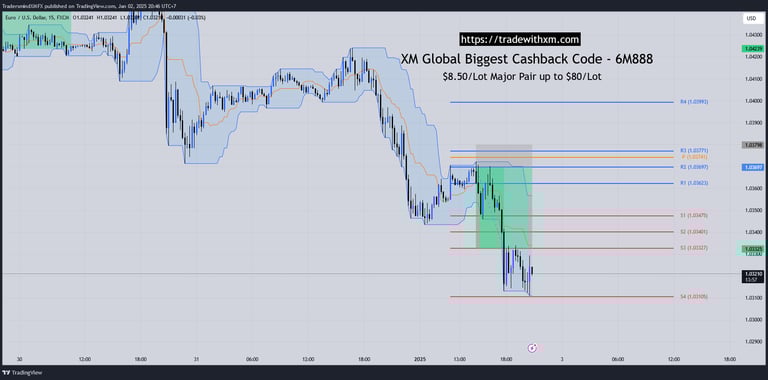
The EUR/USD pair is trading within a descending trend as shown on the 15-minute chart. Recent price action reflects bearish momentum with multiple failed attempts to break through significant resistance levels. The inclusion of pivot points and Bollinger Bands on the chart further aids in understanding support and resistance dynamics.
Key Observations
Resistance Levels:
R1 (1.03623): The first key resistance level. Prices showed minor rejection around this level earlier.
R2 (1.03697): The second resistance level, near which bullish momentum failed to sustain.
R3 (1.03771): A major resistance ceiling. Breaking this level would signify a reversal in trend.
Support Levels:
S1 (1.03475): A temporary floor that the price is hovering above.
S3 (1.03327): This area is currently being tested, and a strong breakdown here could lead to S4 (1.03105), which is a critical support zone.
Bollinger Bands:
The price is oscillating near the lower band, suggesting persistent bearish pressure. A move towards the middle band could hint at consolidation or potential reversal.
Pivot Point (P):
The pivot point at 1.03741 serves as a neutral area. The inability of the price to hold above it confirms bearish dominance.
Volume and Momentum:
Selling pressure has intensified during sessions, as indicated by long bearish candles. The lack of strong bullish attempts further supports the bearish outlook.
Trading Strategies
Bearish Bias:
Look for selling opportunities below 1.03475, targeting S3 and S4. A stop-loss above 1.03623 (R1) would help manage risk.
Bullish Reversal:
A confirmed breakout above 1.03623 with volume could lead to a retracement toward R2 and R3.
For Sellers:
Consider short positions near resistance zones (R1 or Pivot) targeting S3 or S4, with stop-loss orders placed above R1 (1.03623) to manage risk.
For Buyers:
A bounce from S4 (1.03105) or a breakout above R1 (1.03623) could offer buying opportunities targeting R2 (1.03697) and beyond.
Scalping Opportunities:
Global macroeconomic factors such as weaker European data and strengthening of the US dollar index (DXY) are influencing bearish momentum. Traders should keep an eye on upcoming economic announcements for the eurozone and the US, which could impact this pair significantly.
XM Cashback Promotion Highlight
Maximize your earnings while trading the EUR/USD pair with XM Global's Cashback Partner Code: 6M888! By using this code, you can enjoy cashback of:
$8.50 per lot traded on major currency pairs, including EUR/USD.
Up to $80 per lot for other instruments.
This cashback allows you to improve profitability, especially in a trending market like EUR/USD. To join and claim your rebates, visit XM Global.
Why Partner with XM?
Low spreads and high leverage for maximum potential gains.
Fast execution speeds to capitalize on rapid price movements.
Regular cashback that directly adds to your trading returns.
The EUR/USD pair remains under bearish pressure, with key support levels being tested. Traders should watch for breakouts or consolidations at major levels to decide their positions. By integrating XM's cashback offer into your trading plan, you can add additional profitability to your trades.

XM GLOBAL INTRODUCING BROKER
Lifetime 90% cashback on every transactions with XM Global under our IB partnership, rebates only works if you're using our XM Partners Code 6M888
CONTACT
owner@tradewithxm.com
© 2024. All rights reserved.
XM Global Limited, registered by the Financial Services Commission (FSC) under the Securities Industry Act 2021 (license number 000261/4) and Trading Point of Financial Instruments Limited, authorised and regulated by Cyprus Securities and Exchange Commission (CySEC) (licence number 120/10), are members of Trading Point Group.
Risk Warning: Our services involve a significant risk and can result in the loss of your invested capital.
Restricted Regions: XM Global Limited does not provide services for the residents of certain countries, such as the United States of America, Canada, Argentina, Israel and the Islamic Republic of Iran.