
XAUUSD GOLD Pivot Point Today
December 27 - How to plan daytrading perfectly? A full guides to gold pivot point trading. XM Global Rebate Cashback $8.50/Lot on GOLD XM Partner Code 6M888
TECHNICAL ANALYSISMARKET UPDATES
12/27/20242 min read
Gold (XAU/USD) Analysis Using Pivot Points and Bollinger Bands
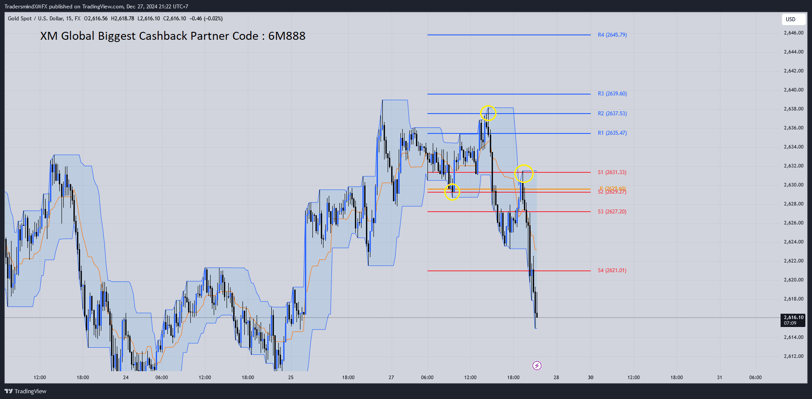
The chart provided depicts Gold's price movement (XAU/USD) on a 15-minute timeframe, leveraging key technical indicators such as pivot points and Bollinger Bands. These tools offer valuable insights into potential market direction, key support and resistance levels, and volatility.
Understanding the Chart
Pivot Points:
Pivot points are a popular technical analysis tool used to identify potential support and resistance levels. The chart includes:
Resistance Levels (R1, R2, R3, R4): Indicating potential price ceilings.
Support Levels (S1, S2, S3, S4): Marking potential price floors.
These levels provide reference points for traders to anticipate price movements.
Bollinger Bands:
Bollinger Bands consist of three lines: the middle band (a moving average), and the upper and lower bands (standard deviations from the moving average).
The bands help traders gauge market volatility and identify potential overbought or oversold conditions.
Key Observations
Bearish Price Action:
The price has broken below the lower Bollinger Band, signaling increased selling pressure.
The breach of the S2 level (2629.77) and proximity to S3 (2627.20) indicates significant bearish momentum.
Support and Resistance Levels:
Current Support: S3 at 2627.20 serves as a critical area where buyers may step in.
Next Target: If the price continues downward, S4 (2621.01) could act as the next support level.
Resistance: The price must overcome S2 (2629.77) and S1 (2631.33) to reverse the bearish trend.
Volatility Insight:
Narrow Bollinger Bands earlier in the chart suggest periods of low volatility, followed by expansion as the price breaks out, indicating heightened market activity.
Trading Strategies
Bearish Strategy:
Entry: Look for selling opportunities if the price decisively breaks below S3 (2627.20).
Target: S4 (2621.01) or lower levels.
Stop Loss: Place stops above the S3 level to limit risk.
Bullish Strategy:
Entry: Wait for confirmation of a bounce off S3 or re-entry into the Bollinger Bands.
Target: S2 (2629.77) or higher resistance levels.
Stop Loss: Set stops just below S3.
Neutral Strategy:
If the price consolidates around the S3 level, traders might opt for a range-trading strategy, buying near S3 and selling near S2.
Conclusion
The chart indicates a bearish trend in Gold (XAU/USD) as it approaches key support levels. Traders should remain vigilant, using pivot points and Bollinger Bands to plan their trades while managing risks effectively. A break below S3 may signal further declines, while a bounce could provide a short-term recovery opportunity. Always combine technical analysis with fundamental insights for a comprehensive trading approach.


XM GLOBAL INTRODUCING BROKER
Lifetime 90% cashback on every transactions with XM Global under our IB partnership, rebates only works if you're using our XM Partners Code 6M888
CONTACT
owner@tradewithxm.com
© 2024. All rights reserved.
XM Global Limited, registered by the Financial Services Commission (FSC) under the Securities Industry Act 2021 (license number 000261/4) and Trading Point of Financial Instruments Limited, authorised and regulated by Cyprus Securities and Exchange Commission (CySEC) (licence number 120/10), are members of Trading Point Group.
Risk Warning: Our services involve a significant risk and can result in the loss of your invested capital.
Restricted Regions: XM Global Limited does not provide services for the residents of certain countries, such as the United States of America, Canada, Argentina, Israel and the Islamic Republic of Iran.