
GOLD XAU/USD Pivot Point Today
GOLD Market Day Trading With Pivot Point Dec 19- Claim your free pivot point indicator
TECHNICAL ANALYSISMARKET UPDATES
Tradewithxm
12/19/20242 min read
Analyzing XAU/USD Trading with Pivot Points
Pivot points are among the most reliable tools for day traders and technical analysts. The chart above highlights a recent XAU/USD analysis using pivot points, providing key support and resistance levels that help guide trading decisions. Let’s break down this analysis and explain how you can use it in your trading strategy.
Understanding the Chart
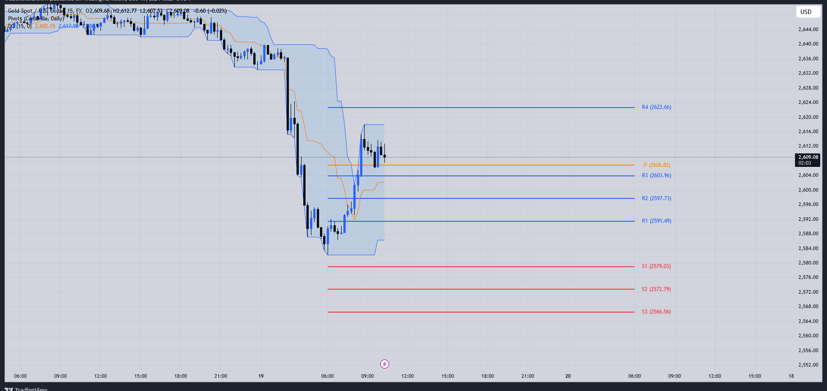
The chart showcases the price movement of XAU/USD (gold vs. the US dollar) on a shorter time frame, overlaid with pivot point levels. Here’s a summary of the pivot points displayed:
Pivot Point (P): 2606.82
Resistance Levels:
R1: 2591.49
R2: 2597.73
R3: 2603.96
R4: 2622.66
Support Levels:
S1: 2579.03
S2: 2572.79
S3: 2566.56
These levels act as benchmarks to predict price reversals or continuations. Pivot points offer a structured approach to trading by defining potential areas of interest.
Key Observations from the Chart
Price Consolidation Near the Pivot Point
The price currently hovers around the pivot point (P: 2606.82). This suggests indecision in the market, where traders are waiting for a breakout to establish a clear direction.Resistance Levels in Play
If the price moves above the pivot point, it may target the resistance levels sequentially (R1, R2, and R3). These levels serve as potential profit-taking zones for bullish traders.Support Levels to Watch
Conversely, if the price drops below the pivot point, it could test support levels (S1, S2, and S3). These levels act as potential buy zones for traders expecting a rebound.Range-Bound Movement
The blue-shaded area on the chart highlights the potential price range. If the price remains within this range, traders might employ a range-bound strategy by buying near support and selling near resistance.
How to Trade Based on This Analysis
Scenario 1: Bullish Breakout
If the price breaks above R1 (2591.49) with strong momentum:
Entry Point: Buy above R1.
Take Profit: Target R2 (2597.73) or R3 (2603.96).
Stop Loss: Below the pivot point (2606.82).
Scenario 2: Bearish Breakdown
If the price drops below S1 (2579.03):
Entry Point: Sell below S1.
Take Profit: Target S2 (2572.79) or S3 (2566.56).
Stop Loss: Above the pivot point.
Scenario 3: Range-Bound Trading
If the price continues to move between the pivot point and R1 or S1:
Buy: Near S1 (2579.03).
Sell: Near R1 (2591.49).
Stop Loss: Below or above the range.
Why Use Pivot Points in XAU/USD Trading?
Objective Trading Levels
Pivot points eliminate guesswork by providing predefined levels based on historical price data.Scalping and Day Trading
For intraday traders, pivot points are invaluable tools to capture small price movements.Improved Risk Management
By setting stop-loss and take-profit orders around pivot levels, traders can manage their risk effectively.
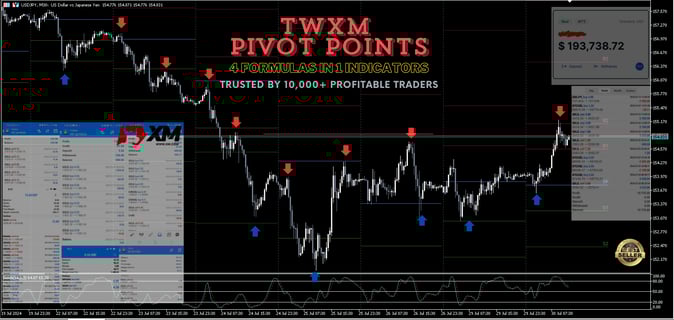
Free Tradewithxm 4-in-1 Pivot Point Indicator
Easy to install - plug in directly to your metatrader 5
Your Capital at Risk*
XM GLOBAL INTRODUCING BROKER
Lifetime 90% cashback on every transactions with XM Global under our IB partnership, rebates only works if you're using our XM Partners Code 6M888
CONTACT
owner@tradewithxm.com
© 2024. All rights reserved.
XM Global Limited, registered by the Financial Services Commission (FSC) under the Securities Industry Act 2021 (license number 000261/4) and Trading Point of Financial Instruments Limited, authorised and regulated by Cyprus Securities and Exchange Commission (CySEC) (licence number 120/10), are members of Trading Point Group.
Risk Warning: Our services involve a significant risk and can result in the loss of your invested capital.
Restricted Regions: XM Global Limited does not provide services for the residents of certain countries, such as the United States of America, Canada, Argentina, Israel and the Islamic Republic of Iran.