


GBPJPY Pivot Point
This technical analysis focuses on GBPJPY. highlighting the key pivot levels and price action movement based on the Pivot Points and other indicators for December 16, 2024.
TECHNICAL ANALYSIS
TradewithXM
12/16/20242 min baca
GBP/JPY Price Analysis – Pivot Point Levels and Market Insight Dec 2024
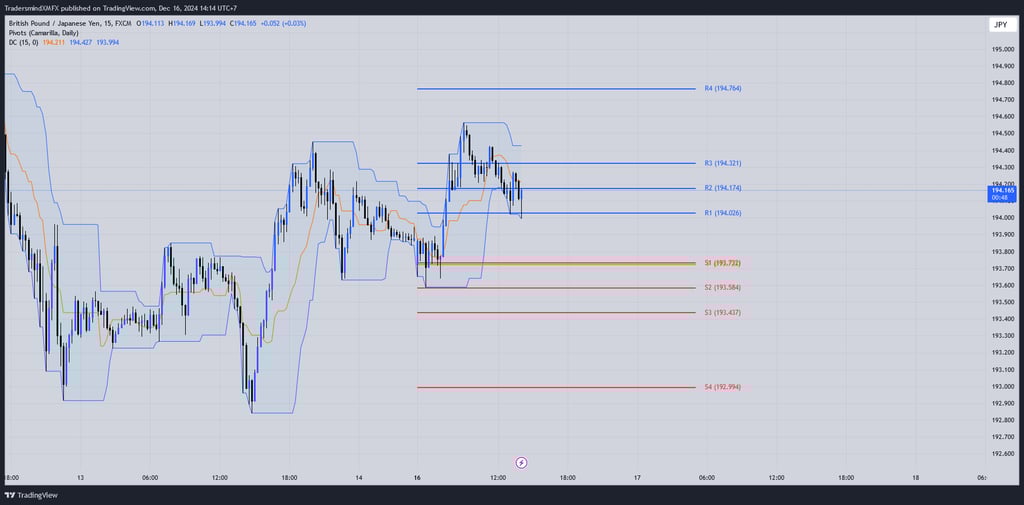
In this GBP/JPY 15-minute chart analysis, we see the British Pound trading against the Japanese Yen at 194.165, reflecting minor downward pressure of -0.03%.
Key Technical Highlights
Pivot Points are plotted to provide support (S1-S4) and resistance (R1-R4) levels.
Resistance Levels
R1: 194.026
R2: 194.174
R3: 194.321
R4: 194.764
Support Levels
S1: 193.722
S2: 193.584
S3: 193.437
S4: 192.994
Current Price Movement
The pair is trading just above R1 (194.026) but below R2 (194.174). The price seems to be consolidating in a tight range, indicating indecisiveness and lower volatility.
If GBP/JPY breaks above R2 (194.174), the next target could be R3 (194.321), followed by R4 (194.764) for bullish continuation.
On the downside, failure to hold above R1 (194.026) could lead the pair to test support at S1 (193.722), and potentially extend downward to S2 and S3 if sellers strengthen.
Donchian Channel (DC)
The blue Donchian Channel bands suggest market volatility zones, with the price trading closer to the upper band. This indicates mild bullish momentum but limited follow-through so far.
The orange median line (15-period) acts as a dynamic support. A break below this line could trigger short-term selling.
Potential Scenarios
Bullish Case
A sustained push above R2 (194.174) could drive the price toward R3 (194.321) and R4 (194.764). Positive sentiment or weaker JPY fundamentals might fuel the upward move.
Bearish Case
Failure to hold current levels may send GBP/JPY toward S1 (193.722), with further downside targeting S2 (193.584) or S3 (193.437).
Conclusion
Traders should watch the price reaction near the R2 (194.174) and the orange Donchian median line for directional bias. A breakout will determine the trend, while a range-bound movement may dominate until a clearer catalyst emerges.
For short-term traders, the pivot points provide actionable areas for entry and exit, while long-term traders can monitor for trend confirmation above or below key support/resistance zones.
Your Capital at Risk*
XM Global Year-End Bonus Claim your 100% Bonus Deposit, and activate your Lifetime 90% Auto Rebate Cashback by using our XM Partner Code 6M888
XM GLOBAL INTRODUCING BROKER
Lifetime 90% cashback on every transactions with XM Global under our IB partnership, rebates only works if you're using our XM Partners Code 6M888
CONTACT
owner@tradewithxm.com
© 2024. All rights reserved.
XM Global Limited, registered by the Financial Services Commission (FSC) under the Securities Industry Act 2021 (license number 000261/4) and Trading Point of Financial Instruments Limited, authorised and regulated by Cyprus Securities and Exchange Commission (CySEC) (licence number 120/10), are members of Trading Point Group.
Risk Warning: Our services involve a significant risk and can result in the loss of your invested capital.
Restricted Regions: XM Global Limited does not provide services for the residents of certain countries, such as the United States of America, Canada, Argentina, Israel and the Islamic Republic of Iran.